If you want to know what your fire department volunteers do, check out the fire incidents map on the town website.
Jay Plato, deputy fire chief for Niagara-on-the-Lake Fire and Emergency Services, says the map has been made public recently, to show the number of calls volunteers respond to each month.
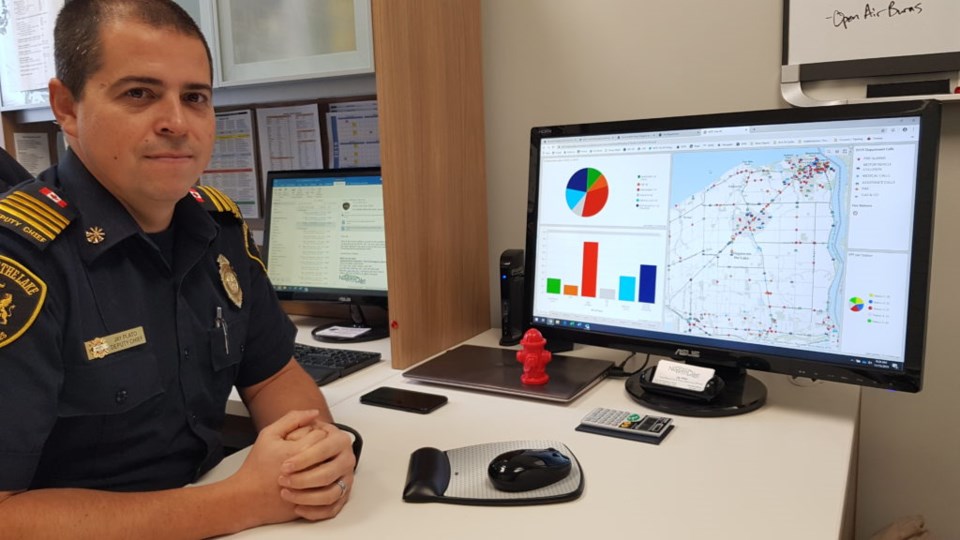
Originally, town GIS staff developed a map to help the department track calls, breaking them down into six categories: fire; fire alarms; gas and carbon monoxide; motor vehicle collisions’ assistance; and medical calls. Each call has a symbol which shows on the map where they occurred.
The map was originally intended as a decision-making tool, which could be used to help the department allocate resources as needed.
It is a much more efficient way to collect data in one location than paper incident reports, he said.
When the tracking map was shown to council, Plato said, it was decided to make it public, to show residents what NOTL fire department volunteers do.
There are now two maps and two online sites: one for internal use, which includes more detail about the incidents, including addresses, the other for the public, which would only show the general area of the incident, to protect residents’ privacy, says Plato.
October’s map and statistics are now available online, and will be updated monthly.
The map has already had about 600 views, says Plato. It is also tweeted to about 1,000 followers of the NOTL fire department, and retweeted to the 7,000 Town of NOTL follower.
The site includes a pie chart which breaks down the percentage of types of calls monthly. In October, the fewest calls, just six per cent were for fires; with the most calls, 26 per cent, for medical assistance. Fire alarms made up 24 per cent of the calls, 22 per cent were for motor vehicle collisions, 12 per cent were assistance calls, and gas and carbon monoxide were 10 per cent.
To view the map, visit https://www.notl.org/fire_incidents_map.